Loading...
Infogram: Create stunning interactive data visualizations, infographics, and charts with AI. Engage your audience and simplify complex data.
Boost this tool
Subscribe to listing upgrades or segmented pushes.
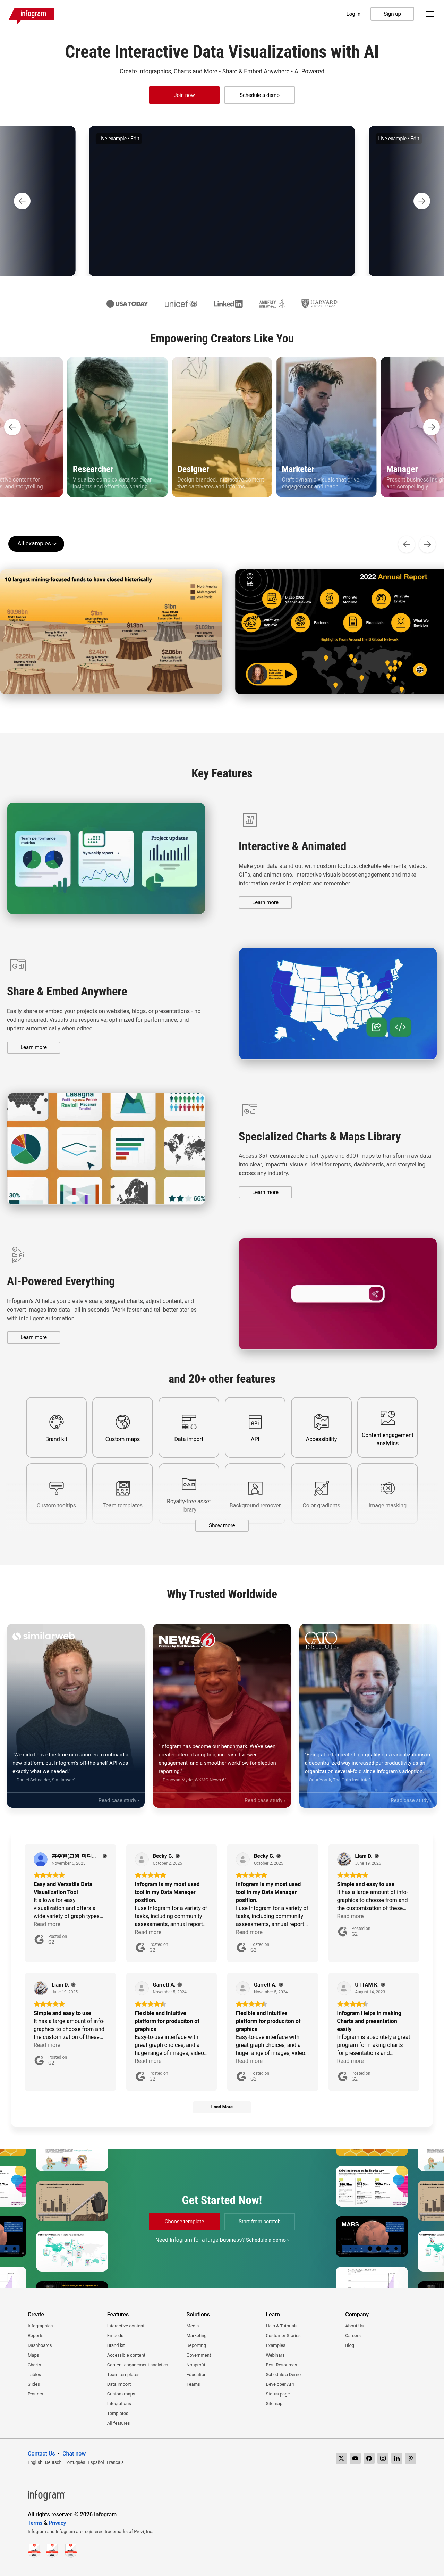
Infogram is an AI-powered data visualization tool that enables users to create interactive charts, infographics, and reports. It focuses on transforming raw data into visually appealing and easily understandable formats, making complex information accessible to a broader audience. The primary benefit is communicating insights effectively and engaging viewers through interactive elements.
Infogram provides a user-friendly interface where users can import data from various sources, including spreadsheets, databases, and cloud services. It offers a wide range of customizable templates and chart types. AI assists in suggesting optimal visualizations and enhancing the design.
Infogram is designed for marketers, journalists, educators, researchers, and businesses of all sizes who need to present data in a compelling and engaging way. It's suited for anyone looking to create professional-quality visualizations without requiring advanced design skills, empowering them to tell data-driven stories and make informed decisions.
Best for marketers and data analysts who need to create compelling and interactive data visualizations to engage their audience and communicate insights effectively.
Not ideal for users who require highly specialized statistical analysis or advanced data modeling capabilities beyond visualization.